Fatal crashes and huge traffic jams: worst US cities for motorists
24 / 7 Wall St. compiled a rating based on data related to driving in different cities of America. It took into account the number of car accidents, as well as the number of deaths and the extent of traffic jams. The result is a list of the worst US cities for driving a car. Most of them are in California, notes USA Today.
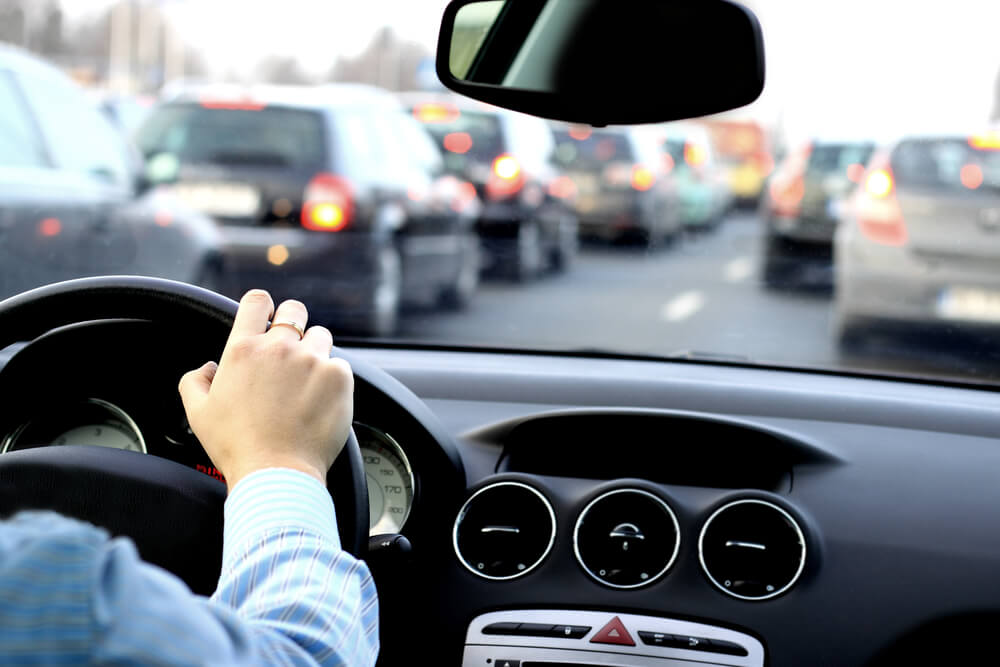
Фото: Depositphotos
20. Baton Rouge, Los Angeles, California
- The number of people killed as a result of an accident on 100 000 people in 2018 year: 20,8 (state: 16,5)
- Average travel time: 27,2 min.
- How many hours were lost due to traffic jams in 2017: 58
- The most dangerous road: US-61
19. Pueblo, Colorado
- The number of people killed as a result of an accident on 100 000 people in 2018 year: 22 (state: 11,1)
- Average travel time: 22,6 min.
- How many hours were lost due to traffic jams in 2017: 20
- The most dangerous road: I-250
18. Los Angeles Long Beach Anaheim California
- The number of people killed as a result of an accident on 100 000 people in 2018 year: 6,4 (state: 9)
- Average travel time: 31,3 min.
- How many hours were lost due to traffic jams in 2017 year: N / A
- The most dangerous road: I-5
17. Napa California
- The number of people killed as a result of an accident on 100 000 people in 2018 year: 9,9 (state: 9)
- Average travel time: 27,8 min.
- How many hours were lost due to traffic jams in 2017: 46
- The most dangerous road: SR-29
16. Merced california
- The number of people killed as a result of an accident on 100 000 people in 2018 year: 20,6 (state: 9)
- Average travel time: 29,1 min.
- How many hours were lost due to traffic jams in 2017: 14
- The most dangerous road: I-5
15. Redding, California
- The number of people killed as a result of an accident on 100 000 people in 2018 year: 16,8 (state: 9)
- Average travel time: 22,3 min.
- How many hours were lost due to traffic jams in 2017: 23
- The most dangerous road: SR-299
On the subject: At an airport in Alaska, a bear breaks into cars, damaging them for thousands of dollars
14. Odessa, Texas
- The number of people killed as a result of an accident on 100 000 people in 2018 year: 36 (state: 12,7)
- Average travel time: 26,1 min.
- How many hours were lost due to traffic jams in 2017: 31
- The most dangerous road: I-20
13. Anchorage, Alaska
- The number of people killed as a result of an accident on 100 000 people in 2018 year: 12 (state: 10,8)
- Average driving time: 23 minutes
- How many hours were lost due to traffic jams in 2017: 42
- The most dangerous road: SR-3 PARKS HWY
12. Bakersfield, CA
- The number of people killed as a result of an accident on 100 000 people in 2018 year: 16,4 (state: 9)
- Average travel time: 23,5 min.
- How many hours were lost due to traffic jams in 2017: 23,6
- The most dangerous road: I-5
11. Atlanta Sandy Springs Roswell, Georgia
- The number of people killed as a result of an accident on 100 000 people in 2018 year: 12,4 (state: 14,3)
- Average travel time: 32,5 min.
- How many hours were lost due to traffic jams in 2017: 76,3
- The most dangerous road: I-75
10. San Francisco Auckland Hayward, CA
- The number of people killed as a result of an accident on 100 000 people in 2018 year: 4,6 (state: 9)
- Average travel time: 34,7 min.
- How many hours were lost due to traffic jams in 2017: 44,8
- The most dangerous road: US-101
On the subject: In California, cars are massively hacked and robbed: police shrug
9. Yuba City, California
- The number of people killed as a result of an accident on 100 000 people in 2018 year: 27 (state: 9)
- Average travel time: 29,2 min.
- How many hours were lost due to traffic jams in 2017: 20
- The most dangerous road: SR-99
8. Sacramento-Rosville-Arden Arcade, California
- The number of people killed as a result of an accident on 100 000 people in 2018 year: 9,8 (state: 9)
- Average driving time: 28 minutes
- How many hours were lost due to traffic jams in 2017: 56,9
- The most dangerous road: I-5
7. El Centro, California
- The number of people killed as a result of an accident on 100 000 people in 2018 year: 20,6 (state: 9)
- Average travel time: 24,5 min.
- How many hours were lost due to traffic jams in 2017 year: N / A
- The most dangerous road: I-8
6. San Diego Carlsbad California
- The number of people killed as a result of an accident on 100 000 people in 2018 year: 7,8 (state: 9)
- Average travel time: 26,6 min.
- How many hours were lost due to traffic jams in 2017: 64
- The most dangerous road: I-8
5. Modesto, California
- The number of people killed as a result of an accident on 100 000 people in 2018 year: 15,5 (state: 9)
- Average travel time: 31,1 min.
- How many hours were lost due to traffic jams in 2017: 29,8
- The most dangerous road: SR-99
On the subject: Top-5 US cities in which you will stand for hours in traffic jams
4. Seattle-Tacoma-Bellevue, WA
- The number of people killed as a result of an accident on 100 000 people in 2018 year: 5,9 (state: 7,2)
- Average travel time: 31,6 min.
- How many hours were lost due to traffic jams in 2017: 75,5
- The most dangerous road: I-5
3. Vallejo Fairfield California
- The number of people killed as a result of an accident on 100 000 people in 2018 year: 12,9 (state: 9)
- Average travel time: 35,1 min.
- How many hours were lost due to traffic jams in 2017: 37,6
- The most dangerous road: I-80
2. Stockton-Lodi, CA
- The number of people killed as a result of an accident on 100 000 people in 2018 year: 14,8 (state: 9)
- Average travel time: 37,2 min.
- How many hours were lost due to traffic jams in 2017: 33,7
- The most dangerous road: I-5
1. San Jose Sunnyvale Santa Clara, California
- The number of people killed as a result of an accident on 100 000 people in 2018 year: 6,2 (state: 9)
- Average travel time: 29,8 min.
- How many hours were lost due to traffic jams in 2017: 81
- The most dangerous road: US-101
Read also on ForumDaily:
In California, cars are massively hacked and robbed: police shrug
Twenty useful things that every car should have in winter
10 models of cars that are stolen most often
Cars that are most frequently and least likely to be stolen in the USA
Subscribe to ForumDaily on Google NewsDo you want more important and interesting news about life in the USA and immigration to America? — support us donate! Also subscribe to our page Facebook. Select the “Priority in display” option and read us first. Also, don't forget to subscribe to our РєР ° РЅР ° Р »РІ Telegram and Instagram- there is a lot of interesting things there. And join thousands of readers ForumDaily New York — there you will find a lot of interesting and positive information about life in the metropolis.


-
Where in the USA to buy the medicines we are used to: a list of pharmacies5330
-
Six ways to cut your medical bill in the US436
-
Joy to Work: 37 Jobs with Lowest Stress and Good Pay419
-
What folk remedies treat the common cold in the USA: what surprises our354
-
Personal experience: why immigrants have more chances of success in the USA than Americans290
-
Burger Arthritis: How Fast Food Triggers Autoimmune Diseases233
-
XNUMX stunning US lavender farms that will take you to French Provence220
-
Actions in a terrorist attack: how to survive yourself and help others6333
-
Where in the USA to buy the medicines we are used to: a list of pharmacies5330
-
How to hit the jackpot: tips from a man who won the lottery 7 times4898
-
Life after death: what happens to places of mass executions in the USA3883
-
How to start a profitable business in the USA, if you have only $ 203281
-
4 US Social Security Traps and How to Avoid Them1493
-
Street, avenue, boulevard or drive: how to understand the classification of US streets and roads1461